Welcome to this week’s Market’s Compass Emerging Market’s Country ETF Study, Week #409, that is being published in my Substack Blog. It will highlight the technical changes of the 22 EM Country ETFs that I track on a weekly basis and publish every third week. In celebration of National Andrews Pitchfork Week, both paid and free subscribers will receive this week’s Emerging Market’s Country ETF Study sent to their registered e-mail. This will allow free subscribers a onetime chance to see what they are missing out on by having the opportunity read the entire content. Past publications can be accessed by paid subscribers via The Market’s Compass Substack Blog. Next week we will be publishing the The Market’s Compass US Index and Sector ETF Study.
Last Week’s and 8 Week Trailing Technical Rankings of the Individual EM ETFs
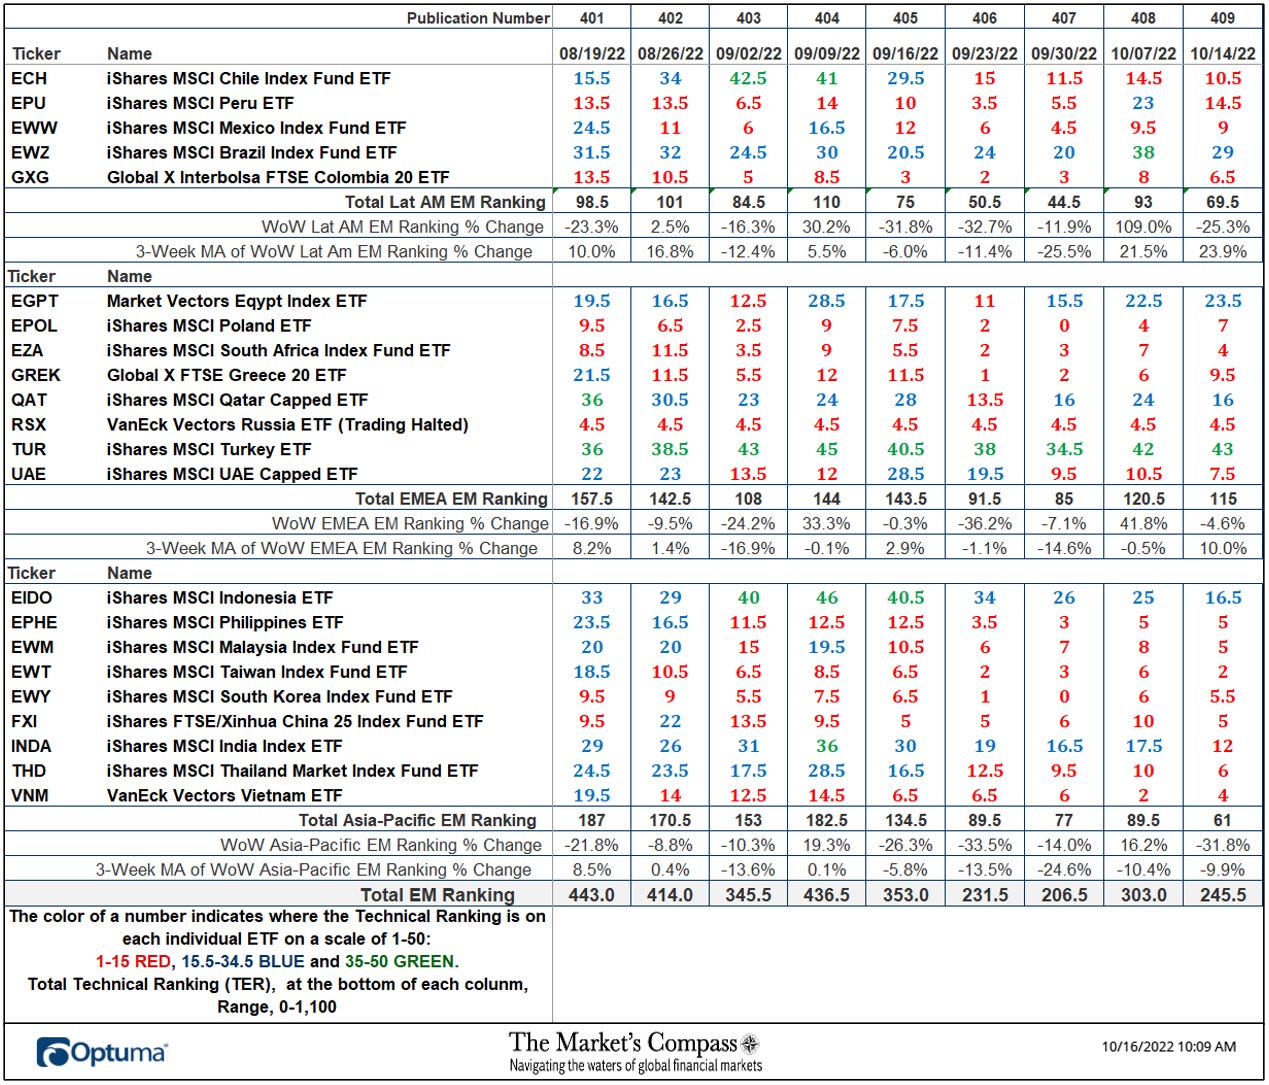
The Excel spreadsheet below indicates the weekly change in the Technical Ranking (“TR”) of each individual ETF. The technical ranking or scoring system is an entirely quantitative approach that utilizes multiple technical considerations that include but are not limited to trend, momentum, measurements of accumulation/distribution and relative strength. If an individual ETFs technical condition improves the Technical Ranking TR rises and conversely if the technical condition continues to deteriorate the TR falls. The TR of each individual ETF ranges from 0 to 50. The primary take away from this spread sheet should be the trend of the individual TRs either the continued improvement or deterioration, as well as a change in direction. Secondarily, a very low ranking can signal an oversold condition and conversely a continued very high number can be viewed as an overbought condition, but with due warning, over sold conditions can continue at apace and overbought securities that have exhibited extraordinary momentum can easily become more overbought. A sustained trend change needs to unfold in the TR for it to be actionable. The TR of each individual ETF in each of the three geographic regions can also reveal comparative relative strength or weakness of the technical condition of the select ETFs in the same region.
The largest gain in the three EM Region Total Rankings since we last published on September 26th for the week ending September 23rd was in the Lat/AM region which rose +37.5% to 69.5 from the 50.5 reading registered four weeks ago. That is followed by a slightly lesser gain of +25.7% in the EMEA Region Total Technical Ranking which rose to 115 from 91.5 over the same period. The Asia-Pacific region Total Technical Ranking registered a loss of -31.8% over the same period. Suffering from a knock effect of the decline in the Total Asia-Pacific Technical Ranking the Total EM Technical Ranking rose only +6.0% to 245.5 from 231.5 since the last EM Country ETF Blog was published.
The Week Over Week Change in Individual Technical Rankings
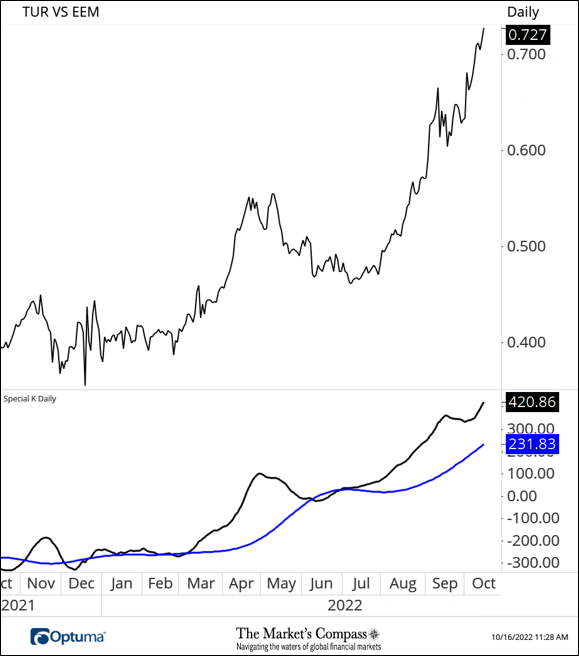
Five EM Country ETF registered an improvement in its individual Technical Ranking (“TR”) one was unchanged (excludes the VanEck Vectors Russia ETF (RSX) where trading has been halted for months) and fifteen saw their TRs fall. The average TR loss over the week was -2,61 “handles. The best TR gain week over week was in the Global X FTSE Greece 20 ETF (GREK) whose TR rose by 3.5 “handles” to 9.5 from 6. Although it rose by only one TR “handle” I have chosen to highlight the iShares MSCI Turkey ETF (TUR) not only because it has the highest TR “score” but because of it’s superior relative strength as witnessed by the TUR / EEM relative ratio in the chart below. Readers will note that this is a recurring theme that will present itself again further on in this blog post (see YTD relative performance).
The Technical Condition Factor changes over the past week and previous 8 weeks
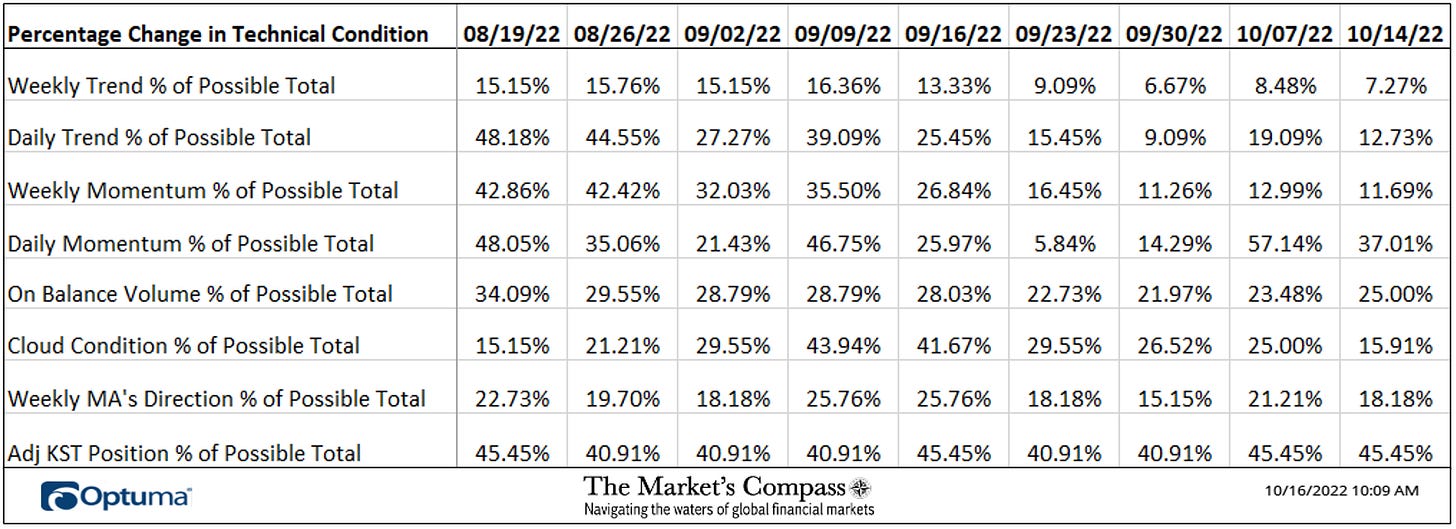
There are eight Technical Condition Factors (“TCFs”) that determine individual TR scores (0-50). Each of these 8, ask objective technical questions (see the spreadsheet posted above). If a technical question is positive an additional point is added to the individual TR. Conversely if the technical question is negative, it receives a “0”. A few TCFs carry more weight than the others such as the Weekly Trend Factor and the Weekly Momentum Factor in compiling each individual TR of each of the 22 ETFs. Because of that, the excel sheet above calculates each factor’s weekly reading as a percent of the possible total. For example, there are 7 considerations (or questions) in the Daily Momentum Technical Condition Factor (“DMTCF”) of the 22 ETFs (or 7 X 22) for a possible range of 0-154 if all 22 ETFs had fulfilled the DMTCF criteria the reading would be 154 or 100%. This past week a 37.01% reading in the DMTCF was registered for the week ending September 23rd, or 57 of a possible total of 154 positive points. This was a drop from the week ending October 7th when the DMTCF marked a 57.14% reading. One technical take away would be if the DMTCF rises to an extreme between 85% and 100% it would suggest a short-term overbought condition was developing. Conversely a reading in the range of 0% to 15% would suggest an oversold condition was developing. The week ending September 23rd the DMTCF was 5.84% suggesting a short-term oversold condition had developed. As a confirmation tool, if all eight TCFs improve on a week over week basis, more of the 22 ETFs are improving internally on a technical basis, confirming a broader market move higher (think of an advance/decline calculation). Last week six TCFs fell, one gained slightly (On Balance Volume TCF) and one was unchanged.
The EEM with the Total ETF Ranking “TER” Overlayed
The Total ETF Ranking (“TER”) Indicator is a total of all 22 ETF rankings and can be looked at as a confirmation/divergence indicator as well as an overbought oversold indicator. As a confirmation/divergence tool: If the broader market as measured by the iShares MSCI Emerging Markets Index ETF (EEM) continues to rally without a commensurate move or higher move in the TER the continued rally in the EEM Index becomes increasingly in jeopardy. Conversely, if the EEM continues to print lower lows and there is little change or a building improvement in the TER a positive divergence is registered. This is, in a fashion, is like a traditional A/D Line. As an overbought/oversold indicator: The closer the TER gets to the 1100 level (all 22 ETFs having a TR of 50) “things can’t get much better technically” and a growing number individual ETFs have become “stretched” the more of a chance of a pullback in the EEM. On the flip side the closer to an extreme low “things can’t get much worse technically” and a growing number of ETFs are “washed out technically”, a measurable low is close to being in place and an oversold rally will likely follow. The 13-week exponential moving average, in red, smooths the volatile TER readings and analytically is a better indicator of trend.
The iShares MSCI Emerging Market ETF (EEM) has fallen -4.92% over the past two weeks and the TER has risen +6.0% to 245.5 from 231.5. Before the TER bounce two weeks ago the TER reached 206.5, matching the TER low registered on July 15th. Thus far this has produced a short term divergence vs. the new bear market weekly closing low of 34.21 in the EEM at the end of last week (green dashed lines).
It would be premature to suggest that the positive divergence is an indication that the unrelenting selling pressure that has gripped the EEM has reached its terminus. That said, it would not be a stretch to suggest that the EEM at the very least is due for at counter trend price move. A look at the short-term technical condition follows later in this blog post.
The Average “TR” Ranking of the 22 ETFs
The Average Weekly Technical Ranking (“ATR”) is the average Technical Ranking (“TR”) of the 22 Emerging Markets Country ETFs we track weekly and is plotted in the lower panel on the Weekly Candle Chart of the EEM presented below. Like the TER, it is a confirmation/divergence or overbought/oversold indicator.
A second divergence in another of my proprietary indicators versus price has developed, this time it is the EEM vs the ATR. The week ending September 30th the ATR registered a 9.39 reading matching the July 15th reading as prices continued to drop sharply to new lows (green dashed lines) but the shorter term moving average red line continues to track lower below the longer-term exponential moving average (blue line). One positive technical feature is that on Friday the EEM bounced off support offered by the Lower Parallel (solid red line) of the Schiff Modified Pitchfork (red P1 through P3). Setting aside that short term positive technical feature, the mostly unrelenting downtrend in the EEM since February of 2021 is still intact.
Thoughts on the Short-Term Technical Condition of the EEM
Last Thursday the EEM opened sharply lower at the beginning of the trading session but a price reversal developed and the EEM closed up +0.29% on the day. That price pivot gave birth to the newly drawn Schiff Modified Pitchfork (green P1 through P3). On Friday an attempt to follow through to Thursday’s price reversal failed and the EEM closed at a new bear market low.
A short-term divergence has developed in my newly minted EM Country ETF Daily Momentum Oscillator as price registered a lower low and the oscillator has temporarily held at a higher low (green dashed lines). For that divergence to become certifiable I would need to see prices to hold last Thursday’s low at 33.65 and eventually a higher high in the oscillator. This is likely too much to accomplish in the short-term without the EEM over taking Median Line resistance (green dotted line) and the Kijun Plot (solid green line).
The Emerging Markets Country ETFs Weekly Absolute and Relative Price % Change*
*Does not include dividends, the VanEck Vectors Russia ETF (RSX) is again, omitted.
Only four EM Country ETFs were up on an absolute basis last week. The top two that improved were the Global X MSCI Greece ETF (GREK) up +1.42% followed by the iShares MSCI Turkey ETF (TUR) up +0.97%. These would not normally be worth highlighting if the average absolute loss of the 21 tracked ETFs wasn’t -2.38%. That said, sixteen ETFs outpaced the EEM on a relative basis and five underperformed. Of those five, three were Asia Pacific Country ETFs, the largest underperformer on a relative basis over the past five trading sessions (-4.52%) was the iShares China Large Cap ETF (FXI).
The Relative Return of the 22 EM ETFs Vs. the EEM Index Year to Date*
*Does not include dividends or the RSX
Charts are courtesy of Optuma, data feed is courtesy of Bloomberg Finance L.P.
For readers who are unfamiliar with the technical terms or tools referred to above can avail themselves to a brief tutorial titled, Tools of Technical Analysis or the Three-Part Pitchfork Papers on The Markets Compass website…
https://themarketscompass.com


