


The Market’s Compass Crypto Sweet Sixteen Study
Week #82

Welcome to the the third publication of the Market’s Compass Weekly Crypto Sweet Sixteen Study. The Study tracks the technical condition of sixteen of the larger market cap cryptocurrencies. I have compiled the historic quantitative objective technical ranking data and secondary technical indicators including the Sweet Sixteen Total Technical Rankings and Weekly Average Technical Ranking back to October of 2021. Every week the Studies will highlight the technical changes of the 16 cryptocurrencies that I track as well as individual highlights on noteworthy moves in certain cryptocurrencies and Indexes.
The Excel spreadsheet below indicates the weekly change in the objective Technical Ranking (“TR”) of each individual Cryptocurrency. The technical ranking or scoring system is an entirely quantitative approach that utilizes multiple technical considerations that include but are not limited to trend, momentum, measurements of accumulation/distribution and relative strength. If an individual Cryptocurrency’s technical condition improves the Technical Ranking (“TR”) rises, and conversely, if the technical condition continues to deteriorate, the TR falls. The TR of each individual Cryptocurrency can range from 0 to 50. The spreadsheet below also acts as a “heat map” in that, cryptocurrencies with a TR in the range of 1 to 15 are highlighted in red, 15.5 to 34.5 are noted in blue and TRs in the range of 35 to 50 are in green. The primary take-away from this spread sheet should be the trend of the individual TRs, either the continued improvement or deterioration, as well as a change in direction. A sustained trend change needs to unfold in the individual TRs for it to be actionable. Secondarily a very low ranking can signal an oversold condition and conversely a continued very high number can be viewed as an overbought condition but, as we know, over sold conditions can continue at apace and overbought securities that have exhibited extraordinary momentum can easily become more overbought. Thirdly, the weekly TRs are a valuable relative strength/weakness indicator vs. each other, in addition when the Sweet Sixteen Total Technical Ranking (“SSTTR”), that has a range of 0 to 800, is near the bottom of its range and an individual cryptocurrency has a TR that remains elevated it speaks to relative strength. Conversely if the SSTTR is near the top of its recent range and an individual cryptocurrency has a TR that remains mired at low levels it speaks to relative weakness. Lastly I view the objective Technical Rankings as a starting point in my analysis and it is not the entire “end game”.
This Week’s and 10 Week Trailing Technical Rankings of the 16 Individual Cryptocurrencies*

*Rankings are calculated up to Friday
As can be seen in the spread sheet above there has been a contraction in the individual objective technical ranking (TR) of the Crypto Sweet Sixteen week over week as well as the Total Sweet Sixteen Technical Ranking (TSSTR). The TSSTR fell -27.7% to 416 from the previous weeks overbought reading of 576 (chart and further discussion of that technical condition follows later in the Blog).

On a Wow basis, all sixteen Cryptocurrencies registered deterioration in their objective TRs. Three Cryptos ended the week in the "green zone” (TRs of between 35 and 50), eleven are in the “blue zone” (TRs between 15.5 and 34.5) and two ended up in the “red zone” (TRs between 1 and 15). The previous week there were 10 Crypto’s in the green zone and six in the “blue zone”. Another data point that is revealing is the across the board technical deterioration with the average TR dropping -10. Although a few held up better, as can be seen from the average TR lose most were badly dented. Polkadot (DOT) had the most “handles” chopped off its TR by falling -20 to 15 from 35. For the third week in a row Ethereum (ETH) sports the best technical ranking of the Sweet Sixteen and the best relative strength vs. the CCi30 Index*. Charts and comments follow below…
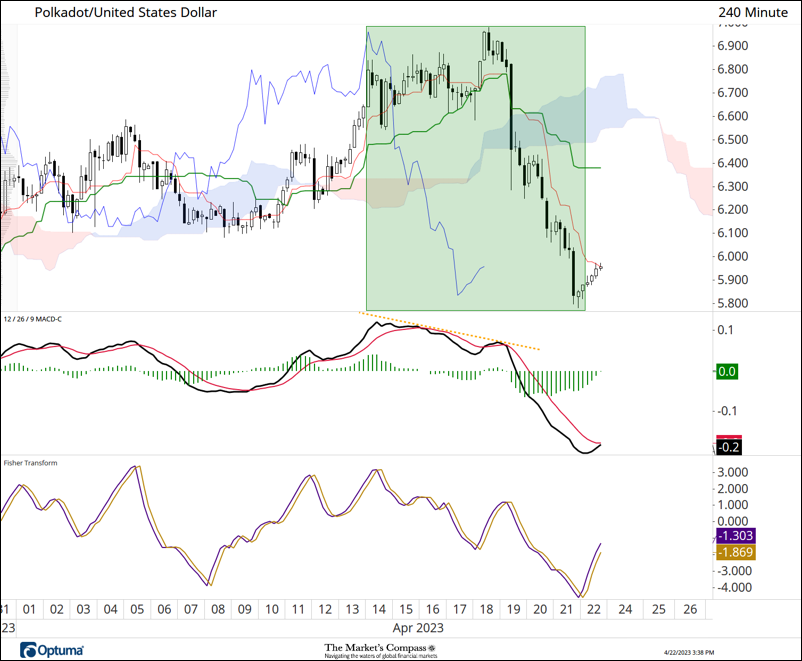
The green box highlights the price action in DOT from Friday to Friday. On Tuesday of last week DOT went on to a new swing high but as can be seen, MACD was signaling a loss of upside momentum (yellow dashed line) despite the higher price pivot which gave a clue, through non-confirmation, that the move higher would not be sustainable and that a price retracement was in the cards. Breaking support at the Kijun Plot (solid green line) and Cloud support on Wednesday suggested that a correction of a larger degree was developing. At the time of writing this note on Saturday afternoon, a feeble bounce had unfolded and both the Fisher Transform and MACD have begun to turn but the technical damage has been formidable and the 6.10/6.20 level will likely cap any continuance of the counter trend rally for the foreseeable future.

*The CCi30 Index is a registered trademark and was created and is maintained by an independent team of mathematicians, quants and fund managers lead by Igor Rivin. It is is a rules-based index designed to objectively measure the overall growth, daily and long-term movement of the blockchain sector. It does so by tracking the 30 largest cryptocurrencies by market capitalization, excluding stable coins (more details can be found at CCi30.com).
Ethereum reached a 2023 high of 2,146.50 last Sunday before last week’s 14% price drop (Sunday’s high to Saturday’s low) but relative to the CCi30 Index ETH has held up far better than any of the other 15 Cryptos we track in these pages. This can be seen in the bottom panel in chart above and below in the string of relative strength charts).
Further Measurements of Relative Strength and Weakness in the Sweet Sixteen
“What’s in Your Wallet?”
A look at the relative strength/weakness of the Crypto Sweet Sixteen versus the CCi30 Index.


Binance (BNB), ChainLink (LINK) and TRON (TRX) have recovered from their 7-month Relative Strength lows versus the CCi30 Index this past week and are back above both their shorter and longer term moving averages.
Relative Rotation Graph of the Sweet Sixteen
The Relative Rotation Graph, commonly referred to as RRGs were developed in 2004-2005 by Julius de Kempenaer. These charts are a unique visualization tool for relative strength analysis. Chartists can use RRGs to analyze the relative strength trends of several securities against a common benchmark, (in this case the CCi30 Index) and against each other over any given time period (in the case below daily since the end of the end of last week. The power of RRG is its ability to plot relative performance on one graph and show true rotation. All RRGs charts use four quadrants to define the four phases of a relative trend. The Optuma RRG charts uses, From Leading (in green) to Weakening (in yellow) to Lagging (in pink) to Improving (in blue) and back to Leading (in green). True rotations can be seen as securities move from one quadrant to the other over time. This is only a brief explanation of how to interpret RRG charts. To learn more see the post scripts and links at the end of this Blog.

The 7-day RRG Chart above reveals the improvement in two of the three aforementioned Cryptos that have recovered on a relative basis vs. the CCi30 Index since the end of last week. Both LINK and BNB are entering or are about to enter the Leading Quadrant along with Cosmos (ATOM). Dogecoin (DOGE) is improving and is turning higher in the Weakening Quadrant while both Ripple (XRP) and Stellar (XLM) have accelerated into Lagging Quadrant from Weakening last week.
Seven Day Absolute % Price Change*

*Sunday to Sunday AM
The Technical Condition Factor changes since the week ending February 10th
There are eight Technical Condition Factors (“TCFs”) that determine individual TR scores (0-50). Each of these 8, ask objective technical questions (see the spreadsheet posted above). If a technical question is positive an additional point is added to the individual TR. Conversely if the technical question is negative, it receives a “0”. A few TCFs carry more weight than the others such as the Weekly Trend Factor and the Weekly Momentum Factor in compiling each individual TR of each of the 16 Cryptocurrencies. Because of that, the excel sheet above calculates each factor’s weekly reading as a percent of the possible total. For example, there are 7 considerations (or questions) in the Daily Momentum Technical Condition Factor (“DMTCF”) of the 16 Cryptocurrencies ETFs (or 7 X 16) for a possible range of 0-112 if all 16 had fulfilled the DMTCF criteria the reading would be 112 or 100%.

This past week a 11.61% reading in the DMTCF was registered for the week ending April 21st, or 13 of a possible total of 112 positive points. The week before the DMTCF reading had risen to a overbought reading of 91.07% or 102 of 112 positive points (overbought reading range from 85% to 100%). The current reading leaves the DMTCF in the short-term oversold range between 0% and 15%.
As a confirmation tool, if all eight TCFs improve on a week over week basis, more of the 16 Cryptocurrencies are improving internally on a technical basis, confirming a broader market move higher (think of an advance/decline calculation). Conversely, if more of the TCFs fall on a week over week basis, more of the “Cryptos” are deteriorating on a technical basis confirming the broader market move lower. Last week 7 TCFs fell and one moved higher confirming the move lower in the broader Cryptocurrency market.
The CCi30 Index with This Week’s Sweet Sixteen Total Technical Ranking “SSTTR” Overlaid
The Sweet Sixteen Total Technical Ranking (“SSTTR”) Indicator is a total of all 16 Cryptocurrency rankings and can be looked at as a confirmation/divergence indicator as well as an overbought oversold indicator. As a confirmation/divergence tool: If the broader market as measured by the CCi30 Index continues to rally without a commensurate move or higher move in the SSTTR the continued rally in the CCi30 Index becomes increasingly in jeopardy. Conversely, if the CCi30 Index continues to print lower lows and there is little change or a building improvement in the SSTTR a positive divergence is registered. This is, in a fashion, is like a traditional A/D Line. As an overbought/oversold indicator: The closer the SSTTR gets to the 800 level (all 16 Cryptocurrencies having a TR of 50) “things can’t get much better technically” and a growing number individual Crypto’s have become “stretched” there is more of a chance of a pullback in the CCi30. On the flip side the closer to an extreme low “things can’t get much worse technically” and a growing number of Crypto’s are “washed out technically” and an oversold rally or measurable low is closer to being in place. The 13-week moving average in Red smooths the volatile SSTTR readings and analytically is a better indicator of trend.

Despite last week’s pullback in the CCi30 Index, the 10-month base building process continues. I was not at all surprised to see a price retracement unfold last week. The SSTTR had entered overbought territory in concert with price approaching potential resistance at the Upper Parallel (solid gold line) of the Schiff Modified Pitchfork (gold P1 through P3). I chose that Pitchfork variation because price respected the Upper Parallel (then support) in June of last year (yellow circle). The 13-Week Moving Average (red line) has begun to roll over but it also did so in March before the next leg higher. I now mark key support at first the Lower Parallel of the Schiff Modified Pitchfork (currently 7200) and next at the P3 swing low. Remembering that my technical thesis is that this a base building process, I still believe that the CCi30 Index will easily challenge price resistance at last June/July highs at the 10,000 /11,000 level in the weeks ahead.
Charts are courtesy of Optuma whose charting software enables anyone to visualize any data including RRG Charts and our Objective Technical Rankings. Cryptocurrency price data is courtesy of Cryptowatch.
The following links are an introduction and an in depth tutorial on RRG Charts…
https://www.optuma.com/videos/introduction-to-rrg/
https://www.optuma.com/videos/optuma-webinar-2-rrgs/
To receive a 30-day trial of Optuma charting software go to…
A three part tutorial series on Andrews Pitchfork may be read at my web site…. www.themarketscompass.com