Multi-Time Frame Bitcoin Study
Where do we go from here?
Weekly… The Weekly chart of Bitcoin reveals technical features that suggest that despite that there may be some backing and filling or corrections of a smaller degree the odds favor that the longer term price structure remains an impulsive 5 wave structure to the upside has yet to run its course.
We initially drew a Schiff Pitchfork (P1 through P3 in green) when prices reversed from the late June 2019 pivot/spike high at green P3. The credence of Pitchfork’s vector or angle was validated when the Median Line served as support for seven weeks from late November to January of this year (green rectangle). During the sharp selloff and subsequent reversal in March we initiated a second Pitchfork, this time a Standard Pitchfork (P1 through P3 in violet) during the week of March 13th. Price resistance at the Median Line four weeks before validated our choice of this Pitchfork variation. We extend Pitchforks backwards to substantiate our choice of Pitchfork variation.
Elliott Wave Count: Our preferred Elliott Wave count is that what has followed since the price pivot at P3 (which, by the way never came close to testing support of the Lower Parallel of the longer term Schiff Pitchfork and was a higher low) is a developing 5 wave impulsive wave structure. Wave (1) pushed back through the Median Line of the Schiff Pitchfork (green circle) and then chopped sideways in Wave (2). A lesser degree wave 1 pump developed but found its terminus at the Upper Parallel and pulled back in wave 2 before Wave 3 of a larger degree unfolded and during the week ending October 23rd Bitcoin rallied sharply through the Upper Parallel of the Schiff Pitchfork (green arrow). To us this and what has followed confirms our thesis that this only a developing 3rd wave. Being conservative, we have marked the center of the third wave at 14,550. If that is indeed the center, then Wave (3) could easily reach 19,165 on a measured move before a lesser degree wave 4 develops.
RSI and the Custom Oscillator: RSI broke out above both the shorter and longer term moving averages in April when price broke out above the Median Line of the Schiff Pitchfork and during the pullback in Wave (2) and wave 2, RSI held above those moving averages (blue arrows). When Wave (3) got under way RSI charged higher and is continuing to climb to new recovery highs. The Custom Oscillator, which unlike RSI is not constricted in a range between 0 and 100 broke out above three consecutive peaks three weeks ago.
Back to Elliott: When higher time frame price action unfolds in this fashion with confirmation by the oscillators long term holders should remain confident the much higher prices will be seen. That said, if our preferred Elliott Wave count is correct a corresponding wave 4 and larger Wave (4) (similar to the Wave (2) and wave 2 pump) will likely unfold before this impulse wave run its course. Those wave 4s should be of interest to traders.
Daily… Prices remain in the price channel (yellow dotted line) that defines the rally that began on October 21st. Both of the adjusted Martin Pring’s oscillators that measure multiple stacked Rate of Change and multiple stacked trend continue to track higher above their signal lines.
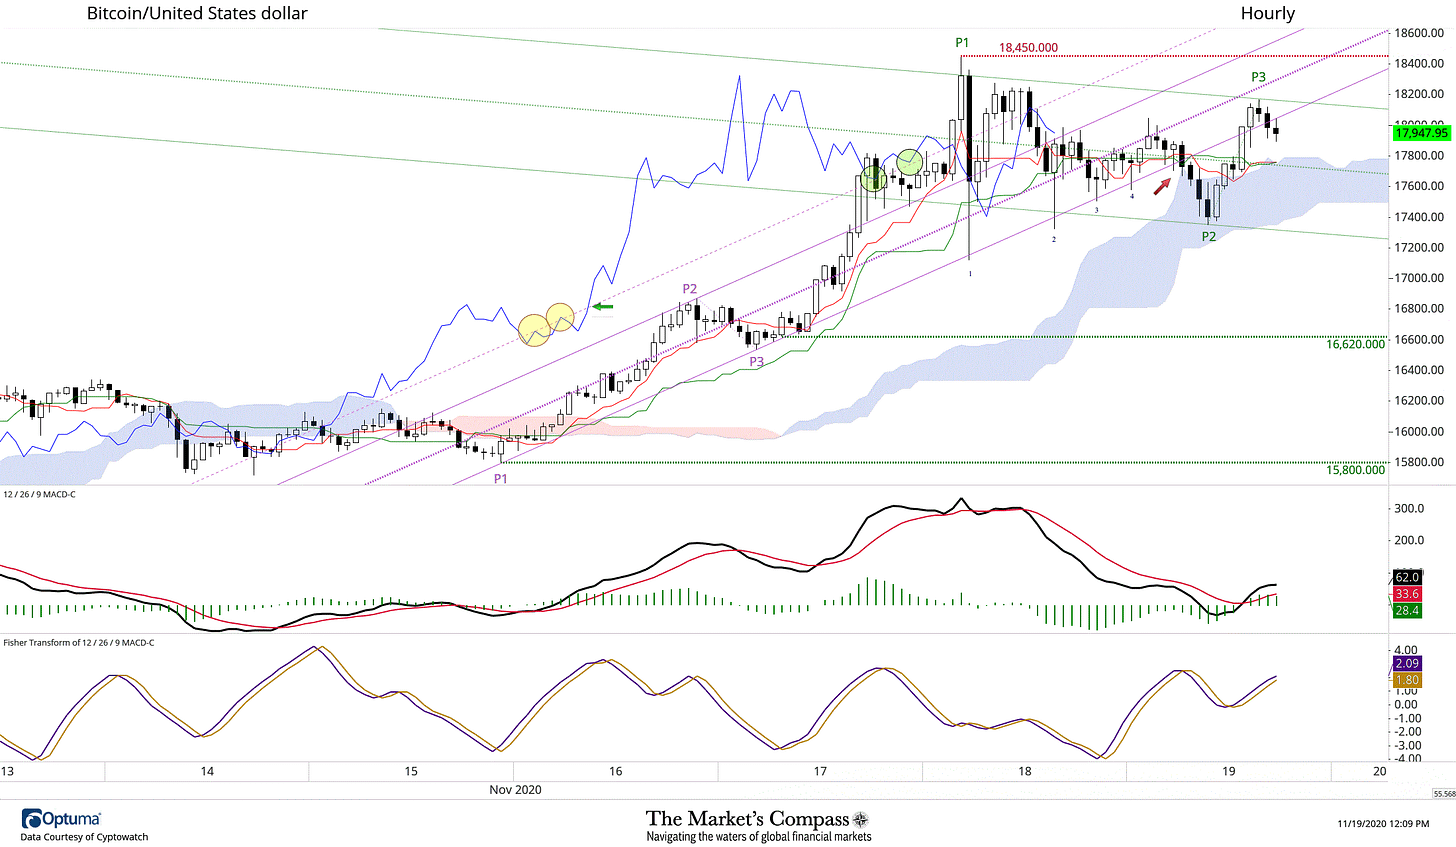
Hourly…We initiated a Schiff Modified Pitchfork (P1 through P3 in violet) after the P3 higher swing low. When prices rallied above the Upper Parallel of that Pitchfork later in the day we drew a parallel Warning Line (violet dashed line). Our immediate observation early Thursday was that after two rejections at the Warning Line (yellow circles) on Monday that the Lagging line (blue line) advanced through the Warning line later in the day. On Wednesday the Lagging Line found support there twice (green circles) until it broke lower but since then it did find support at the Median line. After finding support four times at the Lower Parallel, early this AM price feel through that support and support at the top of the Cloud. It has since recovered but hasn’t yet been able to retake the ground above the Median Line. We have initiated a new Schiff Pitchfork (green P1 through P3) that defines the current counter trend corrective sideways chop and we will be watching for a hint when the current price action has run its course. Hourly MACD has turned up through its signal line and is in positive territory but it has begun to flatten over the past few hours. A rally and close above the Median Line and then the P1 swing high (18,450)will give us confidence that the very short term price correction has run its course.


