Median Line Analysis
Median Line Analysis, A.K.A. Andrews Pitchfork, Part #4, Further Techniques
In this edition of Median Line Analysis, A.K.A. Andrews Pitchfork, Part #4, Further Techniques, I will share further techniques and methods using Pitchforks that were introduced by myself and my collaborator Kyle Crystal of Lakeshore Technical Analysis that were introduced in our STA White Paper about Median Line Analysis / Andrews Pitchfork. These include what we have coined as “Combination Pitchforks” and “Dueling Pitchforks” which when combined create a support and resistance frequency grid in price and time.
Combination Pitchforks:
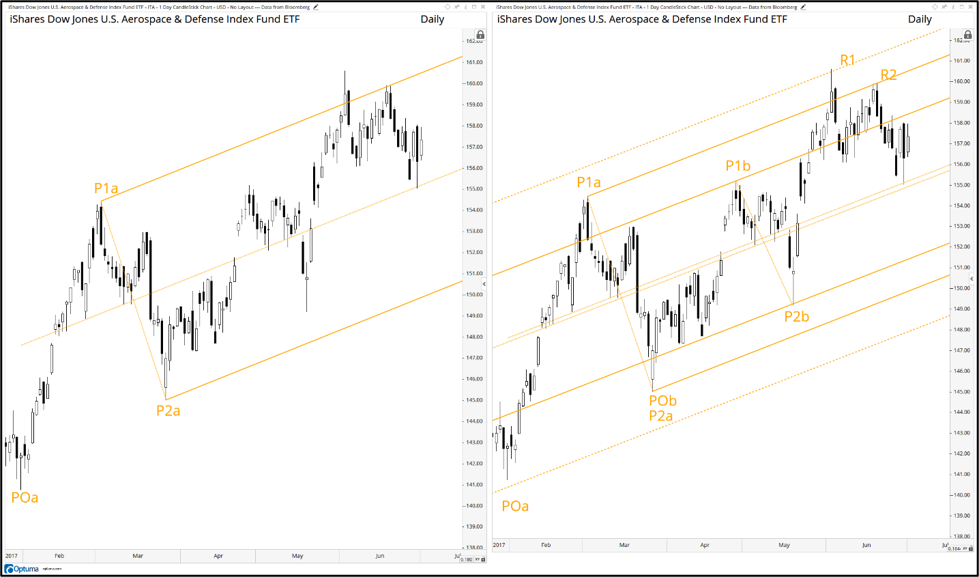
The first example of the author’s analytical method of diagonal discovery is by using what we refer to as “Combination Pitchforks”. In the left panel above, I have applied a Schiff Adjusted Pitchfork (labeled “a”) to the daily chart of the Aerospace & Defense ETF (ITA) using three pivots; the low at POa, to the high at P1a, and higher low at P2a. The panel to the right adds a second Schiff adjusted pitchfork (labeled “b”) utilizing the three pivots that follow; drawn once again from a low at POb, to the high at P1b, and then to the low at P2b. Dashed warning lines are then added outside pitchfork “b”. The reversal at the upper warning line of the second pitchfork at R1 and reversal two and a half weeks later at the upper parallel at R2 indicates I have identified the correct price/time grid. Now observe that both pitchforks, drawn from different pivots, are forming the exact same angle. This is confirmation that I have discovered the dominant frequency within this market’s price/time grid. Going forward, an analyst can continue to utilize this frequency method. How so? See below.
Dueling Pitchforks:
Upon confirmation of a market’s dominant frequencies, a technician can take his or her analysis one step further by employing what we refer to as “Dueling Pitchforks”. This technique utilizes two pitchforks (one bearish, one bullish) to form the price/time grid. In the panel above left we have drawn a Schiff Adjusted Pitchfork on an hourly NASDAQ 100 Index chart from the high at PO (in yellow), to the low at P1, then to the lower high at P2. I then have added multiple warning lines. Note these warning lines have been respected by price. On the panel to the right I have added a Standard Pitchfork (in red) to the same chart starting from the low at PO, to the high at P1, then to the higher low pivot point P2, and similarly, have added multiple warning lines. These two pitchforks, working from a bear and bull perspective, work to reveal the price/time grid acting as diagonal resistance and support.
The chart above of the Daily E-Mini Active Contract serves as another example of Dueling Pitchforks but utilizes three pitchforks to create the price/time grid. The first pitchfork is a Schiff Modified Pitchfork drawn in green from the late February high at PO, down to the April low at P1 and up to the lower high at P2. The second originates at the same April swing low at PO and is drawn in blue up to the swing high at P1 and terminates at P2. This is also Schiff Modified, and for clarity purposes we have color coded it blue. The third is a Standard Pitchfork (in red) drawn from the next swing low at PO, to a higher high at P1 and then down to a higher low P2. This completes the grid.
Recent price action suggests that the price/time grid is beginning to change. This is revealed in the following data points: Price has violated previous resistance now support at the upper warning line in blue, UWL1, and support at the lower parallel LP1, in red, has flipped to resistance. Both of these developments suggest that the “price unit” or leg up since PO may have reached its terminus. What would be the appropriate next step in this analysis given the violation? Add warning lines to the standard pitchfork in red.
In the next Median Line Analysis, A.K.A. Andrews Pitchfork, Part #5, Pitchforks with Momentum Oscillators, I will share further techniques and methods using Pitchforks. I will also share two real time “walk-throughs”
Charts are courtesy of Optuma whose charting software enables users to apply, adjust and modify Pitchfork variations and associated tools in the above charts at a click of the mouse. To receive a 30-day trial of Optuma charting software go to


Thanks for your series on pitchforks Mr. Brackett. Truly enlightening.!
I too am a enthusiast and have made my own rendition of the pitchfork. I made a short vid last night to highlight and archive the absolute wonders of Geometry. Would share it with you if your interested.
I dont think its possible to load a file into here.