Median Line Analysis
A.K.A Andrews Pitchfork, Part 3, Further Construction Basics
Part 3, Further Construction Basics will present further tools that were developed by Dr. Alan Andrews and his students.
Warning Lines
Warning Lines are parallel lines drawn outside the original pitchfork lines. They are drawn equidistant from the Median Line and “tines” or Parallel Lines of the Pitchfork.
I slightly altered the labeling of the chart above and those that follow to PO (point of origin) through P3. I have applied to the chart above, two upper and two lower warning lines (green dashed lines) to the chart that was posted in our last tutorial blog. There is little question now as to the validity of trend or frequency as can be seen by the green circles. It is important to point out that in Pitchfork analysis minor violations on an intra-day or closing basis are not crucial to the spirt of the validity.
Internal Lines
Along with Warning Iines, Internal Lines can also be drawn.
As displayed in the Schiff Pitchfork example above drawn on the Daily S&P 500 Index chart the Internal Lines are drawn at the same angle halfway between the Parallel Lines and the Median Line of the Schiff Pitchfork. I have drawn the Internal Lines in red for clarity purposes. Prices respected support at both the Lower Internal Line and the Upper Internal Line numerous times. I should also add that as long as the Internal Lines are drawn at the same vector or angle of the Pitchfork they can be drawn through trial and error at any spacing between the Median Line aand the Upper and Lower Parallel. Some analysts use Fibonacci ratios.
Sliding Parallels
Sliding Parallels (SP on the example above) are lines drawn parallel to the median line. They can be drawn between the upper and lower parallels or outside the confines of the pitchfork (an example of an Outside Sliding Parallel is posted below. They always share the same angle and represent internal and external support and resistance. On close inspection of the chart above readers will notice that the sliding parallel (blue line) is very close to a 50% internal line.
Hagopian Lines
Our next example focuses on an additional confirmation tool used in median line analysis. This technique was presented to Dr. Andrews by one of his course members, a Mr. Hagopian. On the chart below, the first Hagopian Line (H1) is drawn from the Point of Origin (PO), or the first price pivot chosen, to P2 or third lower price pivot. The second is also drawn from the PO but this one is drawn to P1, the second chosen price pivot. Both are drawn in blue).
To paraphrase Dr. Andrews, when prices fail to return to the median line (which studies have claimed to occur 80% of the time), a reversal may be on the horizon. In the chart above, price slowed at the 50% internal line, reversed, and broke above the upper parallel line. The reversal is confirmed by price trading though the upper Hagopian Line, labeled H1.
Swing Parallel Lines
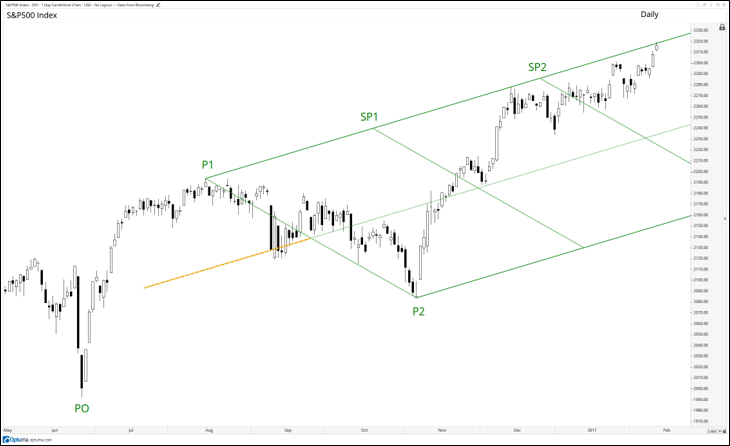
Swing Parallel Lines are lines drawn across the pitchfork parallel to the base or swing line (in the above example P1 to P2 of the Schiff Modified Pitchfork in green). In this case we have not extended the Pitchfork back to better identify the Pitchfork Handle. The distance will be the same as the length of the pitchfork handle (highlighted in orange). These swing parallels, SP1 and SP2, further identify points of support and resistance on the price grid.
In the next Median Line Analysis, A.K.A. Andrews Pitchfork, Part #4, Further Techniques, I will share further techniques and methods using Pitchforks. These include what we have coined as “Combination Pitchforks” and “Dueling Pitchforks” which when combined create a support and resistance frequency grid in price and time (one of which we show above). We will also demonstrate pitchforks used in concert with Momentum Oscillators and Elliott Wave.
Charts are courtesy of Optuma whose charting software enables users to apply, adjust and modify Pitchfork variations and associated tools in the above charts at a click of the mouse. To receive a 30-day trial of Optuma charting software go to


