


Friday Technical Tutorials
The Pitchfork Papers... Chapter One

Introduction
We are adding a new weekly feature to our Substack Blog that will help readers understand the construction and interpretation of various tools of technical analysis. This will be published on Friday mornings. Over the next several weeks we will be publishing an adaptation of two published white papers on Median Line Analysis aka. Andrews Pitchfork that were submitted to and published by the Society of Technical Analysts, the UK”s professional body for technical analysts, these were authored by myself and fellow technician, Kyle Crystal (www.lakeshoretchnicalanalysis.com)
Summary
Price action creates a mathematical grid that, when brought to light, can be used to identify targets, as well as support and resistance levels. The grid becomes visible through independent analysis of three axes: horizontal (price), vertical (time) and diagonal (price and time). The goal of this article is to discuss a few of the techniques found to be invaluable in analyzing the diagonal axis. The other individual axes, vertical and horizontal, will not be discussed in this article.
Analyzing the diagonal axis is traditionally accomplished with trend lines. Two points of contact is the minimum requirement to draw a valid trend line. Pitchforks are unique in that they require three points of contact. The importance of this fact cannot be overstated. Three points of contact allows a pitchfork to triangulate the price/time grid unlike any other tool. And, for those technicians who have ventured into the Gann “rabbit hole”, there are no discussions of hidden factors or scaling charts. In fact, Gann students should consider the implications of our method of diagonal discovery (see Combination Pitchforks in future posts) and its use as an alternative, mechanical method for “reverse engineering” a chart’s factor.
What is Andrews’ Pitchfork?
Although the technical methodology known as Median Line Analysis as we know it today is rightly attributed to Dr. Alan Andrews, it should be known that it found its genesis hundreds of years before his time. That said, it was Andrews who brought it forward to the study of stocks, bonds, currencies, and commodities. Andrews’ extensive analysis and studies are the basis of what is now referred to as Andrews’ Pitchfork. It has been elaborated on since his passing by several of his students who studied directly with him and by a number of learned and talented technicians who have refined and studied it in concert with other indicators. It’s been said his disciples, who were grain traders, were responsible for attaching the moniker Andrews’ Pitchfork to the technique—what we believe is an underutilized technical tool that belongs in every analyst’s toolbox.
Construction Basics
Andrews’ Pitchfork is a trend channel tool consisting of three lines, determined by picking three points on the price chart that mark reaction highs or reaction lows
In the Gold chart below, we’ve marked the start of the median line at a reaction or swing low at Red PO (point of origin). We then mark the next pivot at the high Red P1, and the next pivot at the higher low at Red P2.

The median line is drawn from the first pivot at Red PO, through the midpoint of Red P1 and Red P2, as shown in the chart below.

A “swing line” is added between the Red P1 and Red P2 pivots, and parallel lines are projected from Red P1 and Red P2. This creates the pitchfork which represents a price channel:

Charting software makes drawing Pitchforks a quick and easy with “three” clicks of the mouse. This starts with a left mouse click at the Point of Origin or Red PO (in this case a swing low) then a second mouse click at Red P1 and finally a third mouse click at Red P3. Voila’!
Schiff and Schiff Modified Pitchforks
In addition to the Standard Pitchfork that we applied above, it’s also possible to adjust the point of origin to draw two different variations, Schiff and Schiff Modified Pitchforks. Jerome Schiff was a student of Dr. Andrews who developed the Schiff-adjusted pitchfork, and Dr. Andrews took it one step further with Schiff Modified. The charts below show the calculation and the change in the point of origination of the median line for the three configurations. Note how price in the yellow Schiff Pitchfork better respects the upper and lower parallels or “tines” of the Pitchfork. This configuration would be our analytical choice in this particular example. We will discuss this more, as well as our method and purpose of our “color coding” techniques, as we move forward.

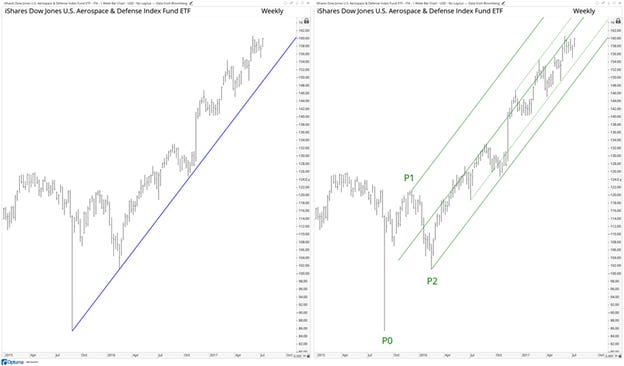
Pitchfork Choice Confirmation
After determining which pitchfork configuration is initially the most appropriate to use in starting a new analysis (Schiff Modified pitchfork on the chart below left), we look to confirm our choice by extending the Pitchfork backwards. We can see when this is done (chart below right), that even prior to the time that the pitchfork was drawn, price respected the angle, or “frequency”, of the trend by noting the price points marked with circles. This gives us a greater level of confidence that the Schiff Modified pitchfork represents the correct trend for this particular chart:

A few additional points:
Firstly, median line analysis can be used in all time frames. The monthly chart of the S&P Metals and Mining ETF (XME) and the hourly chart of the Dow Jones Industrial Average (INDU) serve well as examples.


Secondly, minor violations of support on an intra-period basis, as well as on a closing basis, do not reduce the veracity of the indicator (note chart of the NASDAQ 100 E-Mini Future below). Only when price runs past with conviction, and or “lingers’” in a state of violation, does it suggest that there has been a technical change of the angle, or frequency, in the price/time grid.

Thirdly, and most importantly, in most cases median line/pitchfork analysis is a superior analytical tool when compared to traditional trend line methods, as it gives the chartist far more technical data points to consider during his or her analysis.
In next week’s article we will discuss additional Pitchfork ancillary tools including but not limited to Warning Lines, Internal Lines and Hagopian Lines.
In our experience no other charting software allows one to switch effortlessly between the Pitchfork Variations like Optuma charting software. To try out Pitchforks and the other technical tools I utilize in my analysis, try an exclusive 30-day free trial of Optuma Charting Software: